OVERVIEW OF COMMODITIES
WHEAT
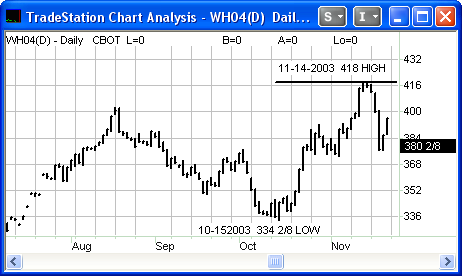
In the chart below of the March 2004 Wheat contract there was a low on October 15, 2003 at 334 1/4. On November 14, 2003 a high was made at 418.
Some of the most important sets of indications were 417, 417.4, 417.8, and 419. There were two MOD3 algorithms in this group. The MOD3 incorporates the Start Time and Start Price with the PEP or Potential End Price. A Class1 and an ON DATE algorithm were also used. In all, there were four indications for resistance in the 417 to 419 area.
CRUDE OIL
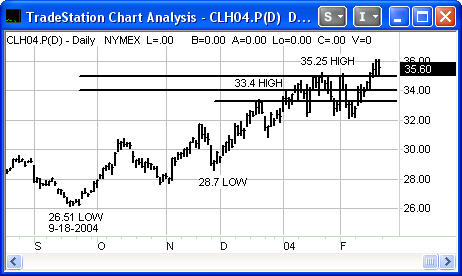
The next chart is April 2004 Crude Oil. The trend is very strong to the upside while oil is on its way to much higher prices. I used the two lows shown below to calculate some resistance points. The first resistance point was at 33.3. The high was 33.4. Note that this is a small reaction in an up trend. Price dropped back to 31 and then resumed the up trend.
There was one indication at 34 where a top formed and price fell to 32.9. The strongest indications were at 34.9 to 35.2. A double top formed at 35.2. A drop to 32 followed. The trend is strongly up and unlike Gann in the 1909 article, I am not inferring that the method will tell one where exactly price is in the existing trend. These points are support and resistance levels and have to be traded in the present.
Copyright ©2001 The StockTimefactor - All Rights Reserved